


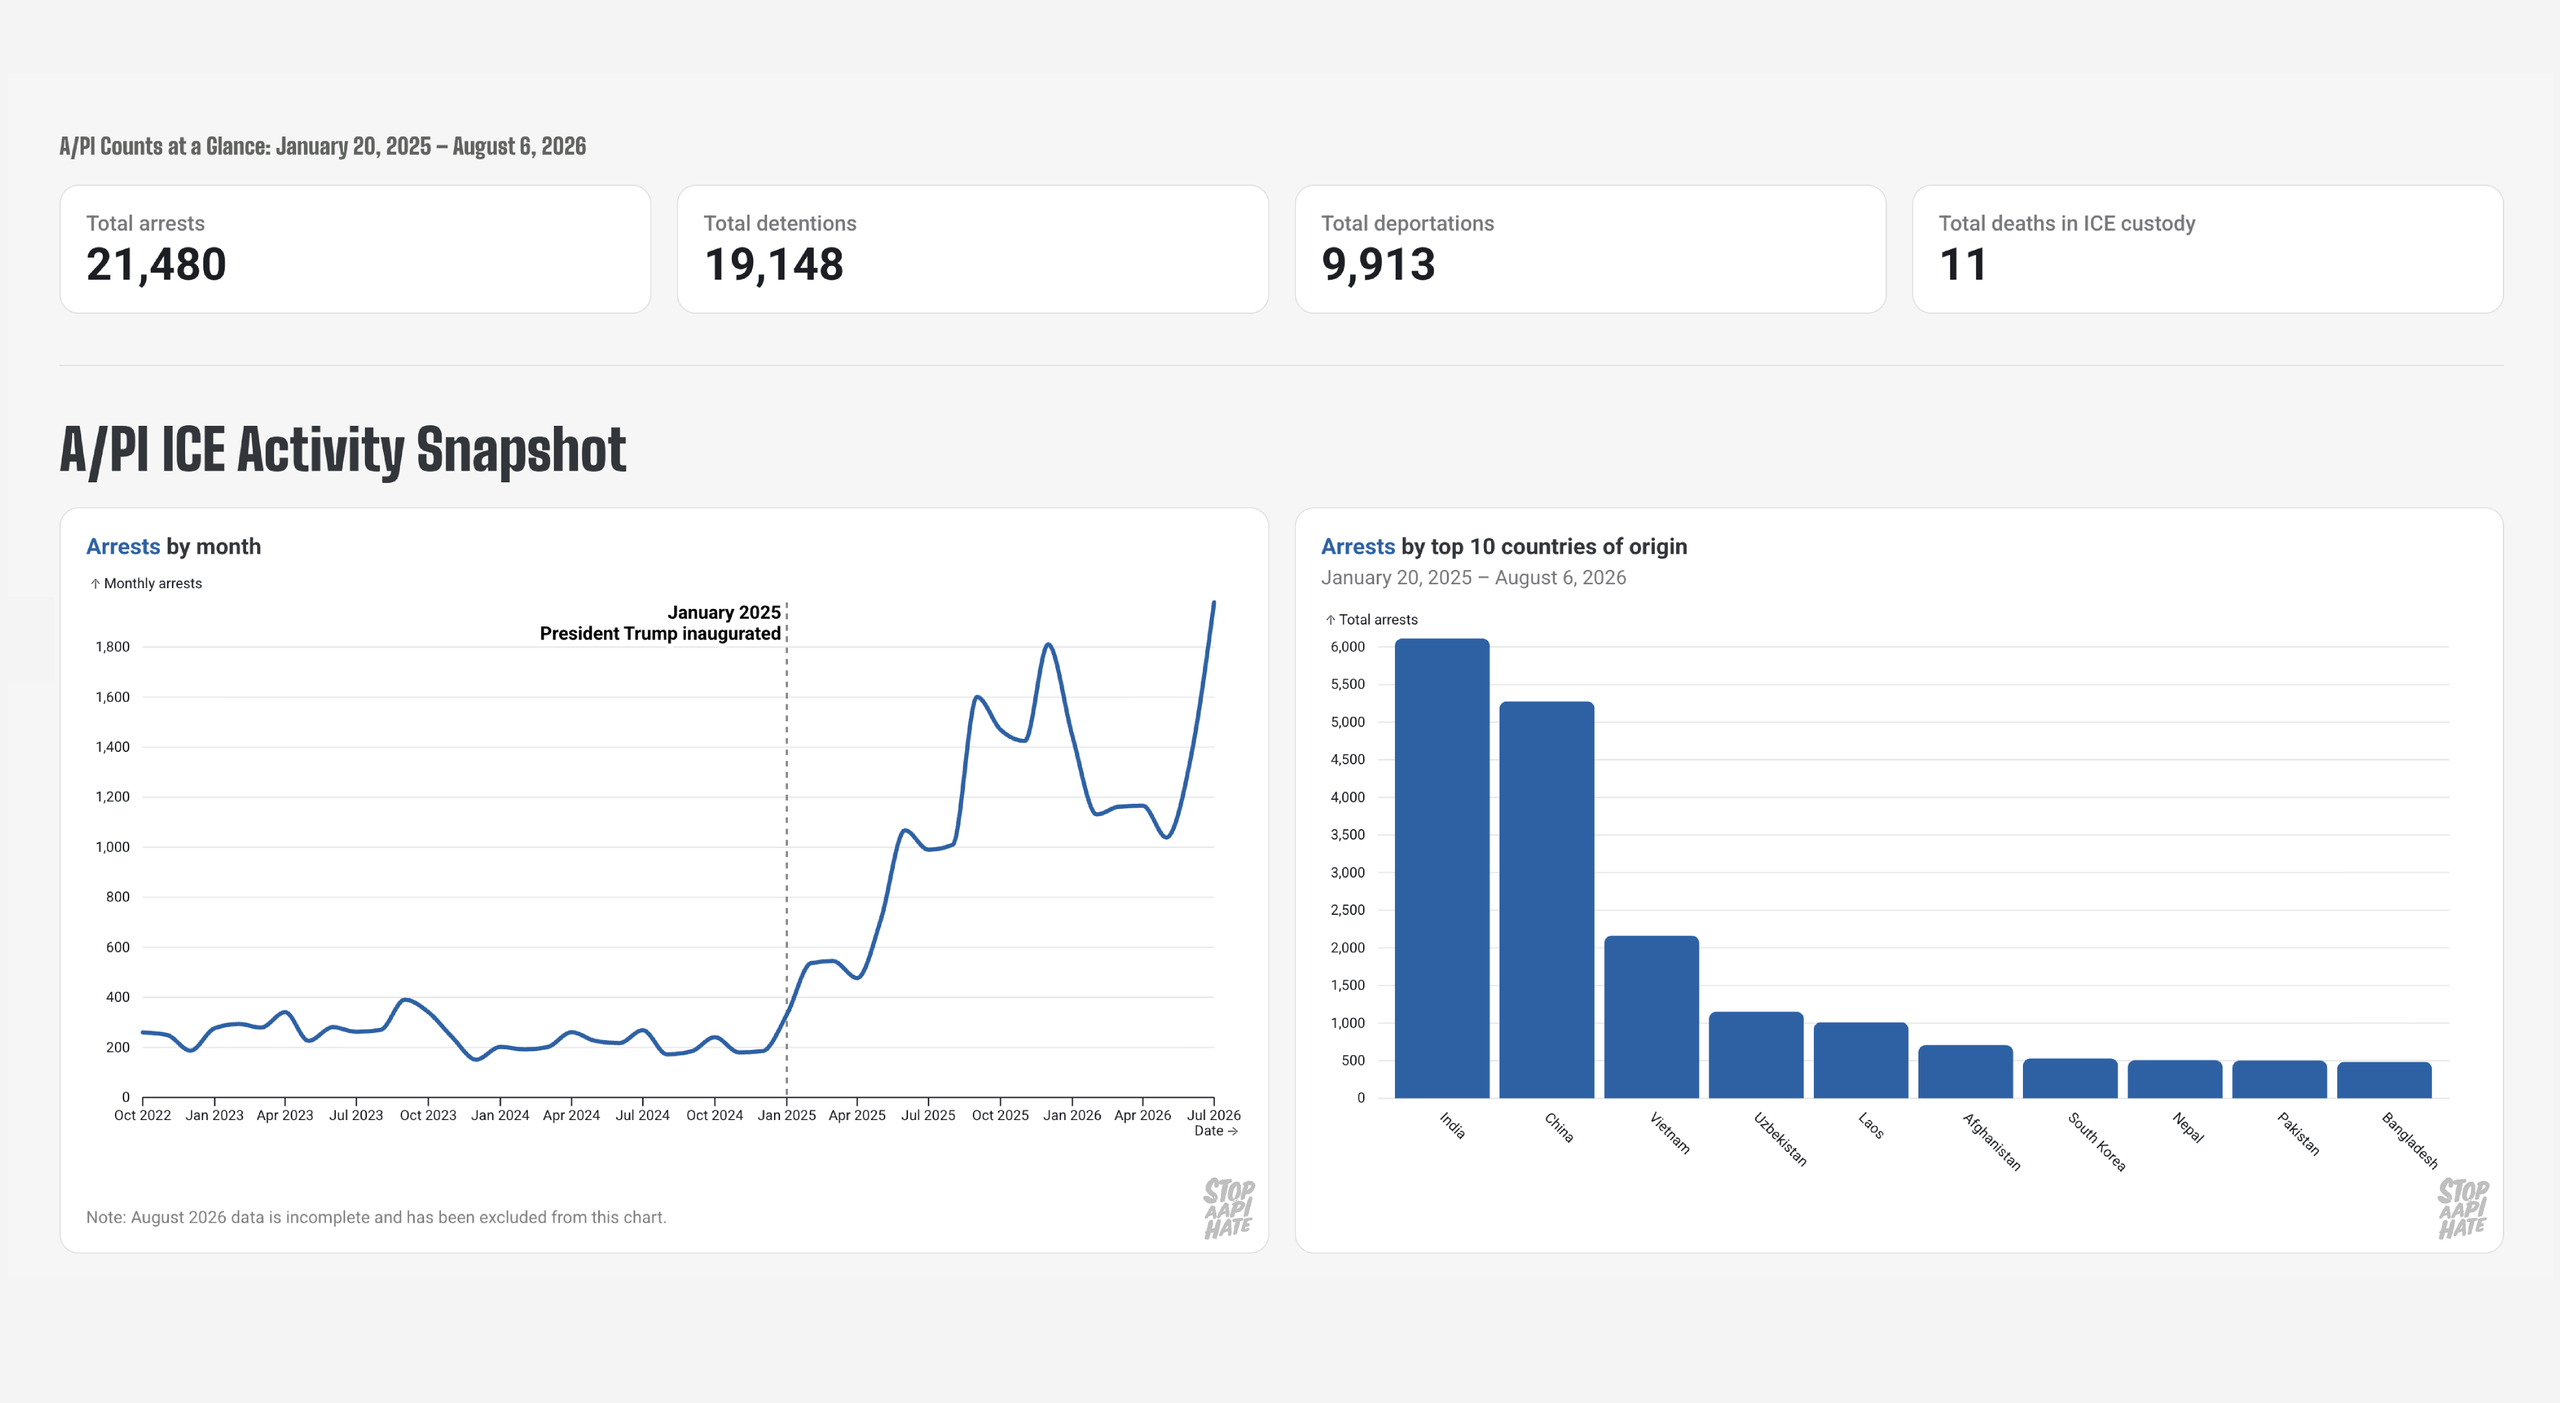
ICE arrests, detentions, and deportations of A/PI people have risen steeply during Trump’s second term.
These fact sheets highlight key statistics from the Asian and Pacific Islander ICE data to show the impacts of immigration enforcement on our communities.
Last updated: September 2026
Key Findings (January 20, 2026 – August 6, 2026)
Asian:
- There were 21,078 Asian ICE arrests, 18,769 detentions, and 9,590 deportations.
- Asian arrests are 5x higher, detentions 6x higher, and deportations 12x higher, compared to an equivalent time period under the previous administration.
- People from India and China accounted for the largest shares of Asian arrests, at 29% and 25%, respectively.
- Some Asian communities have been hit far out of proportion to their population size, including those from Uzbekistan, Laos*, and Vietnam**.
Pacific Islanders:
- There were 402 Pacific Islander ICE arrests, 379 detentions, and 323 deportations.
- Pacific Islander arrests rose 25%, detentions rose 34%, and deportations rose 33%, compared to an equivalent time period under the previous administration.
- People from the Federated States of Micronesia and the Marshall Islands accounted for the largest shares of Pacific Islander arrests, at 47% and 29%, respectively.
* People from Laos include Hmong, Iu Mien, Khmu, Lao, Tai Dam, and other ethnic groups.
** People from Vietnam include Montagnard, Cham, Khmer Krom, and other ethnic communities
Download Resources
Previous Fact Sheets
- January 20, 2025 – March 10, 2026 Data (published May 2026): Asian ICE Fact Sheet; Pacific Islander ICE Fact Sheet
Learn More
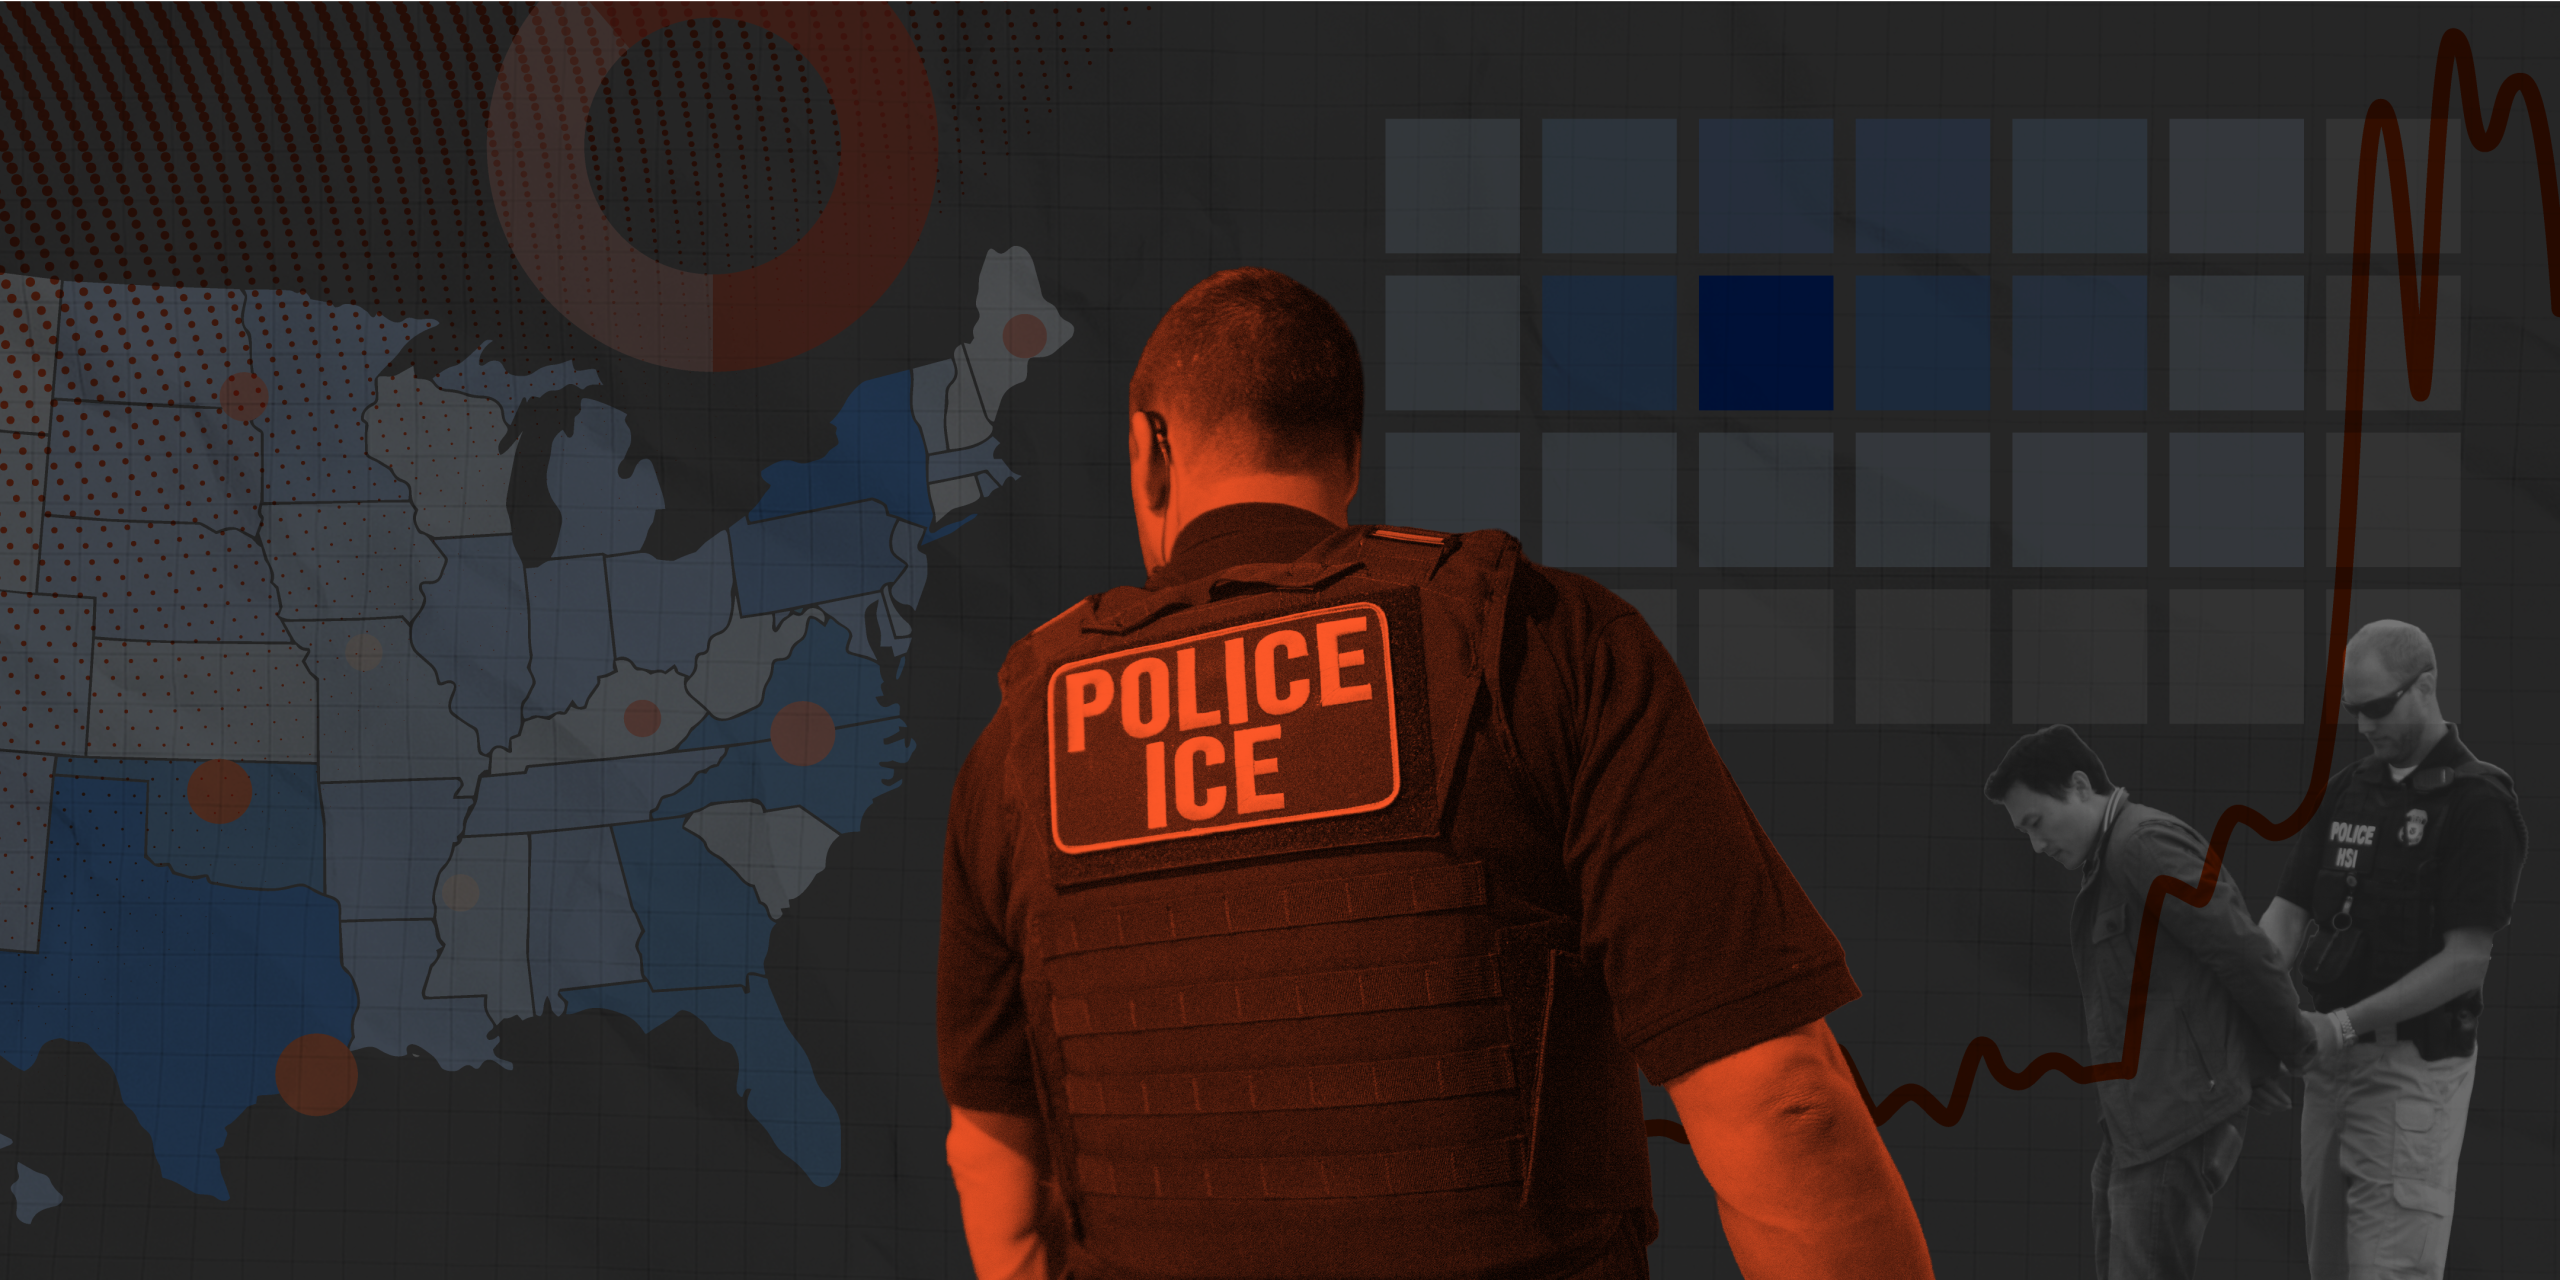
How Asians and Pacific Islanders Are Being Impacted by ICE
This blog highlights key findings from the latest A/PI ICE data and conversations with partners to explore how ICE is affecting our communities.
Asian and Pacific Islander ICE Tracker
This online data tool tracks ICE activity across 35 Asian and Pacific Islander countries of origin and 50 U.S. states and territories.
