
Introducing important upgrades to our reporting center data
Stop AAPI Hate started in 2020 with just three people and a simple online form. Since then, we have received more than 11,000 reports of anti-Asian and anti-Pacific Islander hate. Our reporting center — the largest of its kind in the United States — has enabled us to uplift the stories and voices of Asian Americans (AAs) & Pacific Islanders (PIs) across the nation and significantly increase public awareness of the hate we face. Now, we’re leveling up our approach to data collection and analysis to further deepen our shared understanding of anti-Asian and anti-Pacific Islander racism and discrimination in all its forms — from verbal harassment to civil rights violations to physical attacks and beyond.
In this vein, Stop AAPI Hate is proud to introduce two key advancements to our reporting center data: 1) A new interactive data visualization tool, which improves access to our data and allows for deeper exploration, and 2) Our upgraded data classification system, which enhances how we categorize hate acts and allows us to analyze our data in more ways.
Historically, research on anti-AA and anti-PI hate has been too narrowly focused on hate crimes — leaving a critical knowledge gap around lesser-understood forms of racism. By leveling up the way we collect, analyze, and share data, we can uncover more nuanced findings about the various types of racism and discrimination our communities experience, and ultimately, advocate for comprehensive solutions that address the full range of hate.
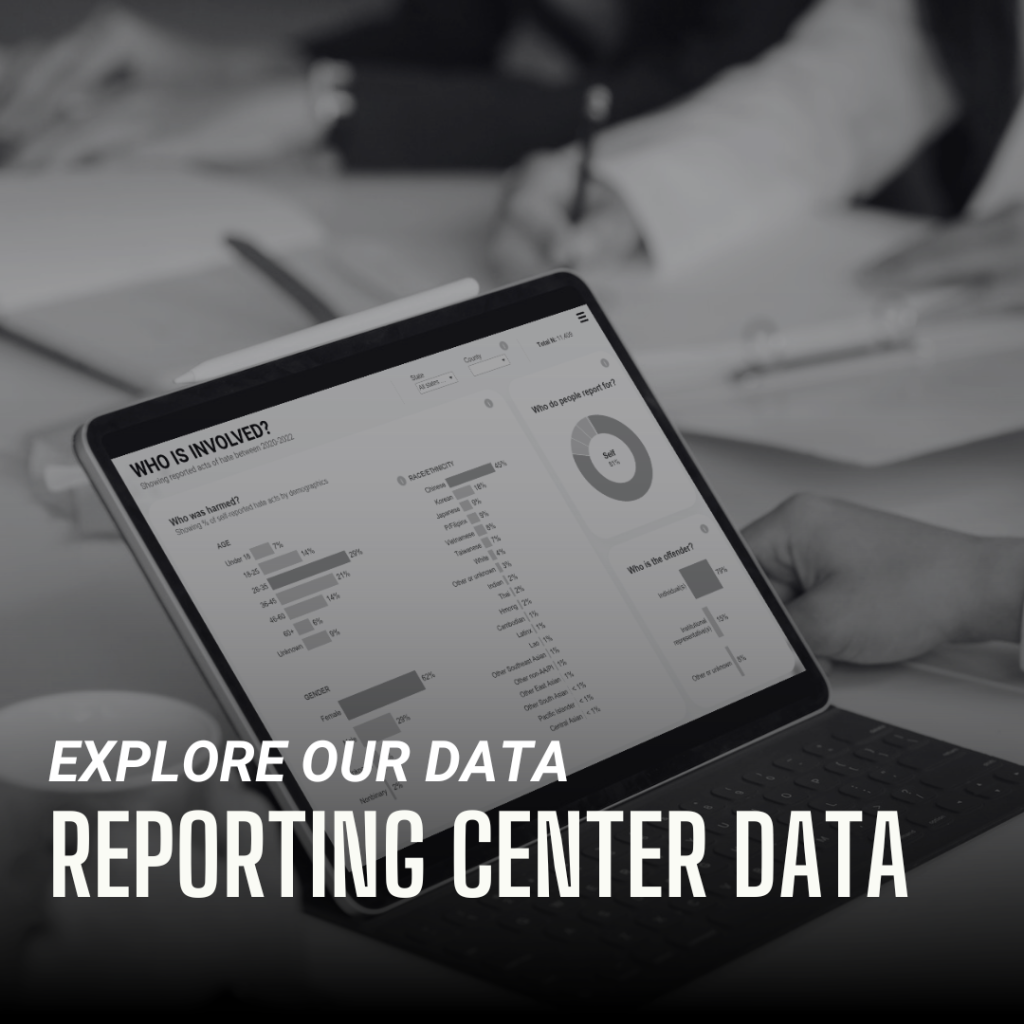
Data Visualization Tool
Our interactive data visualization tool reflects our most up-to-date data, which includes reports of unique hate acts received from January 2020 through the end of December 2022. It blends real-life stories with exploratory dashboards, allowing people to examine our reporting center data in new ways.
The data visualization tool aligns with our commitment to collect data with communities and for communities. By making our dataset more accessible and dynamic, we hope community organizations, journalists, researchers, policymakers, and others can extract deeper insights and leverage them to better serve our communities.
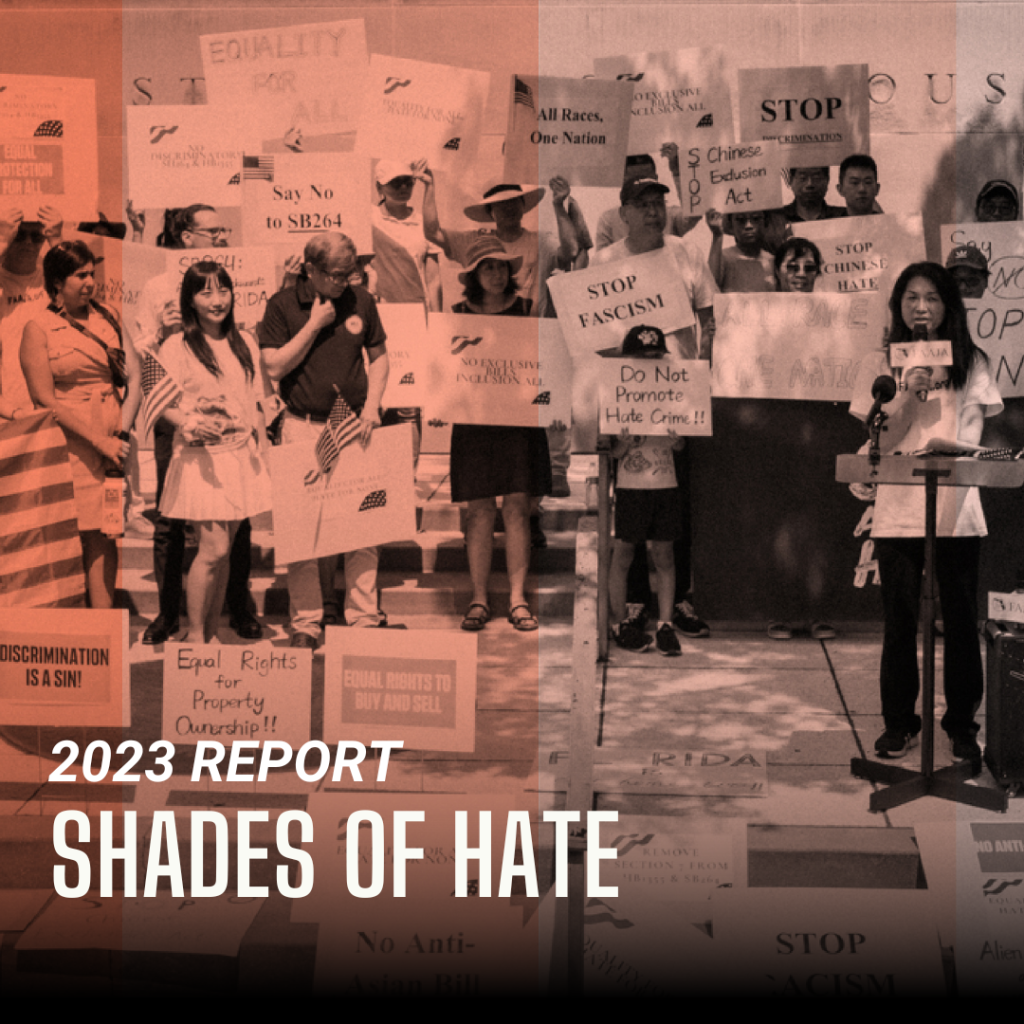
Shades of Hate Report
Our latest report, Shades of Hate: A Deeper Understanding of Asian American & Pacific Islander Experiences, outlines our new data classification system, which determines how we review and categorize hate acts reported to Stop AAPI Hate. More specifically, it dives into our broad definition of hate, details both existing and newly-added categories of hate, and gives us greater insight into the differences between interpersonal versus societal hate; explicit versus coded hate; and individual versus institutional hate.
By allowing us to uncover more details about how our communities experience diverse forms of racism and discrimination, our new classification system for hate acts marks a significant step forward in our coalition’s evolution and the nation’s collective understanding of anti-Asian and anti-Pacific Islander hate.
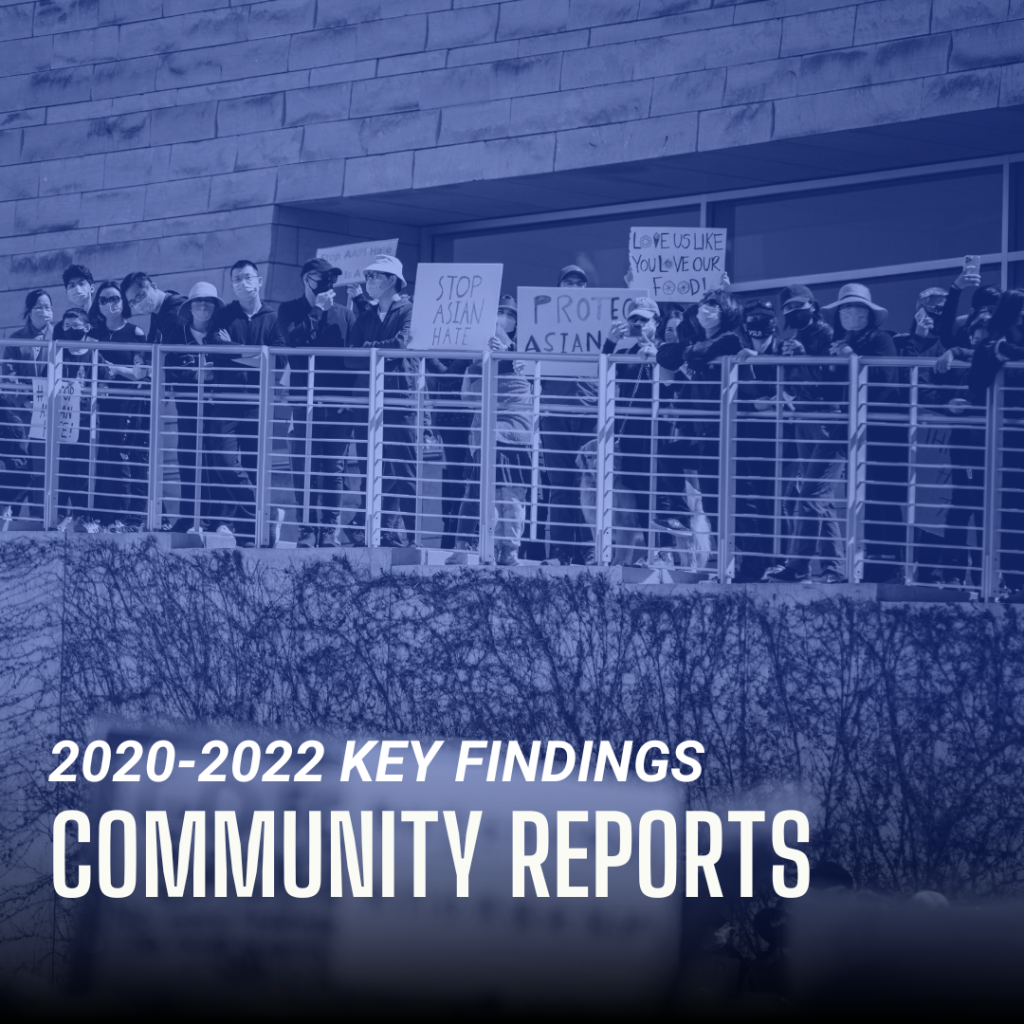
Key Findings Brief
We have compiled key takeaways from a new analysis of our latest dataset, which captures reported hate acts that have occurred between January 1, 2020 and December 31, 2022.
Drawing from a combination of data points and stories from impacted people, our key takeaways brief includes valuable insights into the patterns of hate we see in our reporting center data. This includes information about different types of hate acts; where they take place; who is involved; and how they are experienced. On the whole, these findings help improve our understanding of anti-Asian and anti-Pacific Islander hate and inform effective responses. Key findings include, but are not limited to:
- Most hate acts involve harassment (88%) while 23% of hate acts involve physical contact or harm.
- Hate acts most commonly occur in public spaces (51%) — including sidewalks, parks, or transit — and businesses (28%) — including restaurants, supermarkets, or gas stations.
- People under the age of 18 report a higher percentage of hate acts involving written, visual, or auditory harassment compared to other age groups — most of which take place online and on social media. Meanwhile, people ages 60 and older report a higher percentage of hate acts involving physical injury.
- Over half (51%) of reported hate acts include explicit racial bias. 20% involve coded bias, while 29% involve perceived bias.
- The support of third parties is critical in documenting acts of hate, with an estimated 1 in 6 people reporting on behalf of someone else, including friends, relatives, and even strangers.
- Hate is institutional, not just interpersonal. 15% of offenders worked for or represented an institution — offering insight into how racial bias manifests in institutions like schools or businesses.
Frequently Asked Questions
How are you defining hate?
Our definition of hate is guided by our communities and how they define hate through their reporting. To that end, we uphold a relatively broad definition of hate because Asian Americans and Pacific Islanders experience a broad range of hate — from verbal harassment to physical attacks to institutional discrimination. Although the public has long-focused on violent hate crimes, the majority of hate acts that our communities report are non-criminal acts.
All acts of hate are harmful, whether implicit, explicit, interpersonal, or institutional. We hope our data helps broaden people’s understanding of anti-Asian and anti-Pacific Islander racism and discrimination, as it comes in many forms and requires different solutions.
What are “hate acts” and how are they different from “hate incidents” or “hate crimes”?
Stop AAPI Hate defines a “hate act” or “act of hate” as any event motivated by bias or prejudice, whether explicit or implicit, against a person or group’s actual or perceived identity(ies) that inflicts individual or community harm. Hate acts include both potential hate crimes (criminal bias-motivated offenses) and hate incidents (non-criminal bias motivated events). It is important to understand the overall scope and breadth of hate acts that Asian Americans and Pacific Islanders experience — not just explicit hate crimes. This allows us to fully grasp the impact of racism and discrimination on our communities and to identify solutions to support them.
Our use of the term “hate act” represents a departure from our past use of the term “hate incident” to mean any hate-related event, including both criminal and non-criminal events. We now use the term “hate incident” in a more narrow sense to refer to non-criminal, bias-motivated events in order to align with how the term is conventionally used by most community organizations, scholars, and government entities working in the realm of hate.
NOTE: We caution against making claims about hate crimes based on our data. For something to constitute a hate crime, it must be investigated by law enforcement. Therefore, while a portion of the hate acts reported to us may constitute potential hate crimes, it would be inaccurate to describe our data as hate crime data since these cases may or may not have been reported to law enforcement and investigated.
Why did the coalition update the way it processes its reporting center data?
Researchers consistently strive to improve the way data is collected, analyzed, and shared. By upgrading our data classification system — which includes more detailed categories of hate acts — we can offer a clearer view of the various forms of hate our communities experience. In turn, this deeper understanding helps inform more effective, tailored solutions.
When we’re able to capture and define various forms of hate, beyond just hate crimes, we’re also able to help Asian Americans and Pacific Islanders process and name their varied experiences with racism and discrimination. We hope to provide a vocabulary for people to talk about the hate they have experienced, whether it’s a civil rights violation, verbal harassment, a physical attack, or other form of hate.
How has your methodology changed?
Data shared or published after October 1, 2023 reflects the following primary changes in our methodology:
1) We have more detailed categories for classifying hate acts reported to us, which allows us to gain a clearer and more nuanced understanding of the various forms of hate our communities experience. For example, we introduced a new category of “societal hate act” to track forms of hate that are broader in scope, such as anti-Asian political rhetoric. Hate experienced societally (i.e. pertaining to larger groups of people) calls for different responses than hate experienced interpersonally (i.e. between individual persons).
2) We have revised parameters for including hate act reports in our core data set. For details, please check out our methodology document, available here.
Who should use the data visualization tool and how should they use it?
The data visualization tool can be used by anyone, including journalists, researchers, academics, policymakers, and everyday people. We’ve designed it to be as accessible as possible, and it includes interactive instructions for use.
NOTE: Just like all datasets that rely on voluntary reports from the community, our numbers are just the tip of the iceberg. For every act of hate that is reported, there are many more that go unreported. The volume of reports to Stop AAPI Hate is subject to numerous factors, including but not limited to: awareness of and access to the reporting center, current events that spur reporting, and reporting fatigue.
Therefore, while our data offers critical clues about the various ways our communities experience hate, our numbers should not be used in isolation to represent the full prevalence of anti-Asian or anti-Pacific Islander hate at any given time.
We also caution against making claims about hate crimes based on our data. For something to constitute a hate crime, it must be investigated by law enforcement. Therefore, while a portion of the hate acts reported to us may constitute potential hate crimes, it would be inaccurate to describe our data as hate crime data since these cases may or may not have been reported to law enforcement and investigated.
How often will Stop AAPI Hate’s data visualization tool be updated? Will you continue to release separate data reports?
We plan to update our data on an annual basis. An annual cadence allows us to carefully process each report as well as collect enough data to extract valuable analyses and insights. Our 2023 numbers will be available around Summer 2024.
The data visualization tool will now be the primary way for people to access our reporting center data. We will be releasing accompanying annual data briefs that summarize key findings and insights. Additionally, we will continue to release separate thematic reports based on our data or original studies, including surveys. A report examining the effects of experiencing hate on mental health is one example of a thematic report.