
Learn more about reports of hate from January 2020 – December 2022.
Stop AAPI Hate has analyzed all reported hate acts occurring between January 1, 2020 to December 31, 2022. Our analysis of hate acts submitted to our reporting center uncovers important insights into how Asian Americans and Pacific Islanders experience racism and discrimination. You can read our complete findings here or explore them within the data visualization tool.
Download Resources
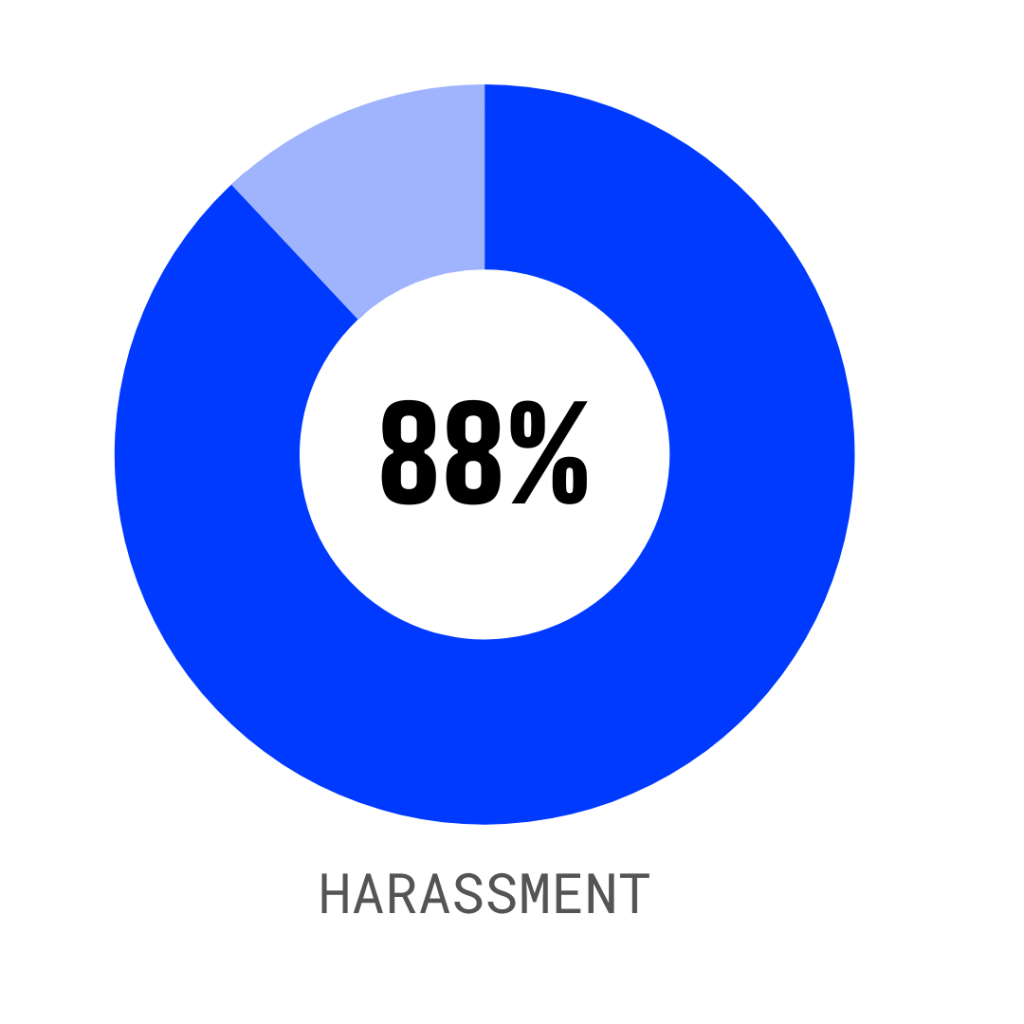
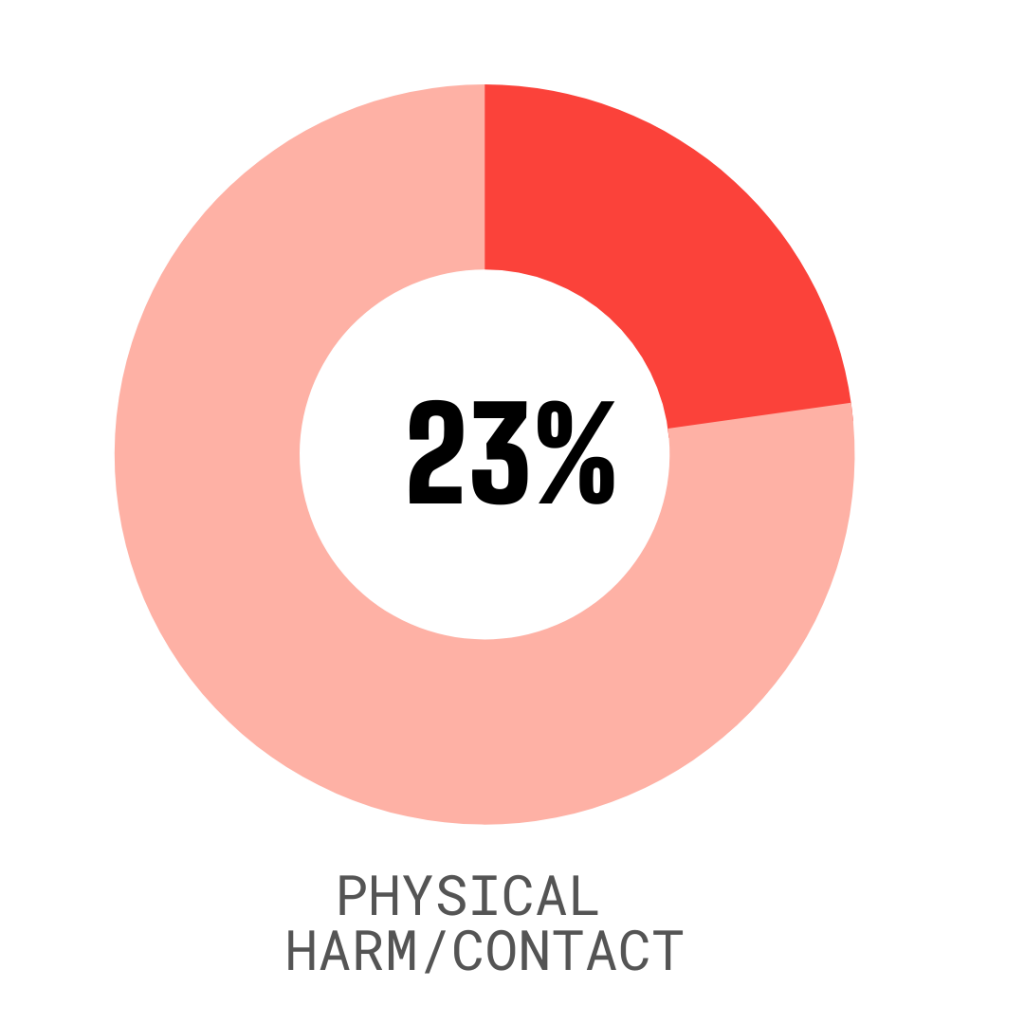
Most hate acts involve some form of harassment (88%) — while 23% of hate acts involve physical contact or harm.
“I was walking up the stairs to [a] restaurant in the…suburbs and this individual said, ‘Hey, Osama Bin Laden.’ I asked him, ‘What did you say?’ and he said, ‘F–k you.’”
– Man, Georgia
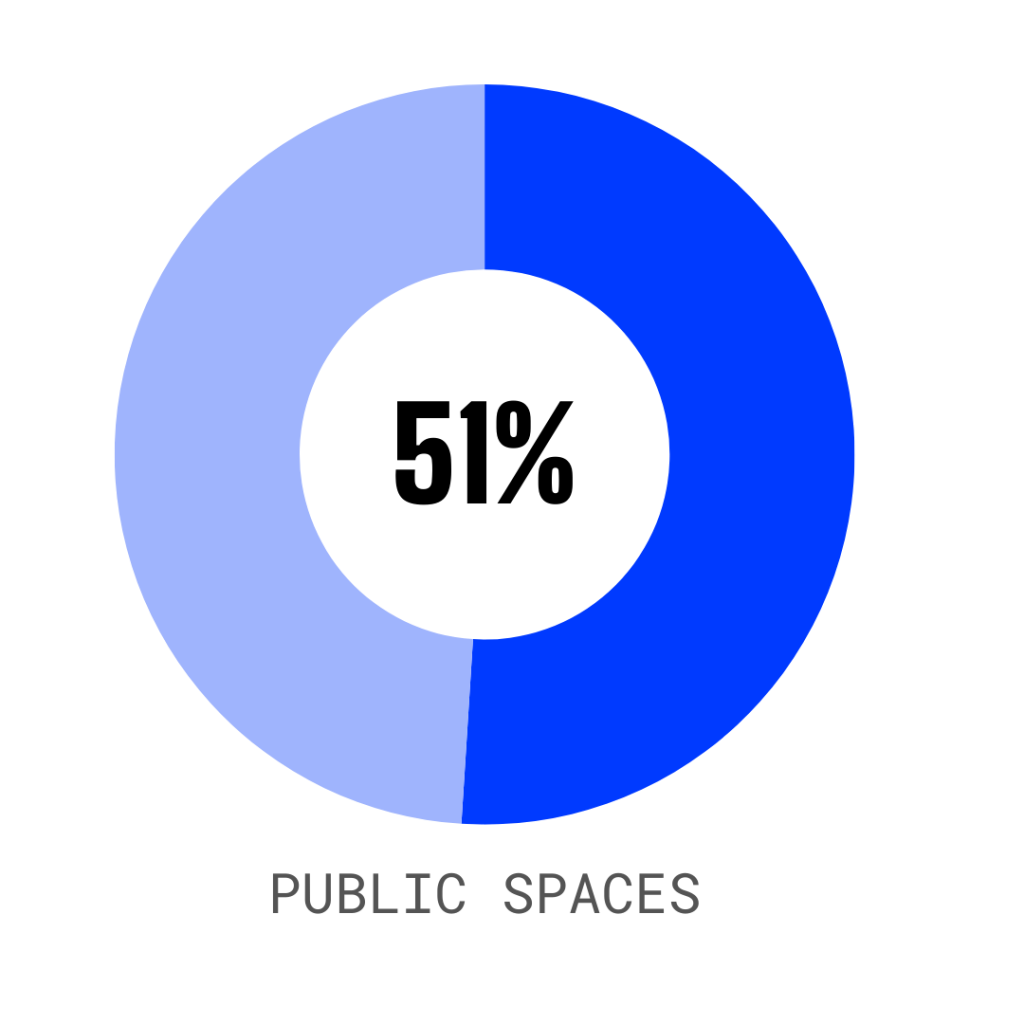
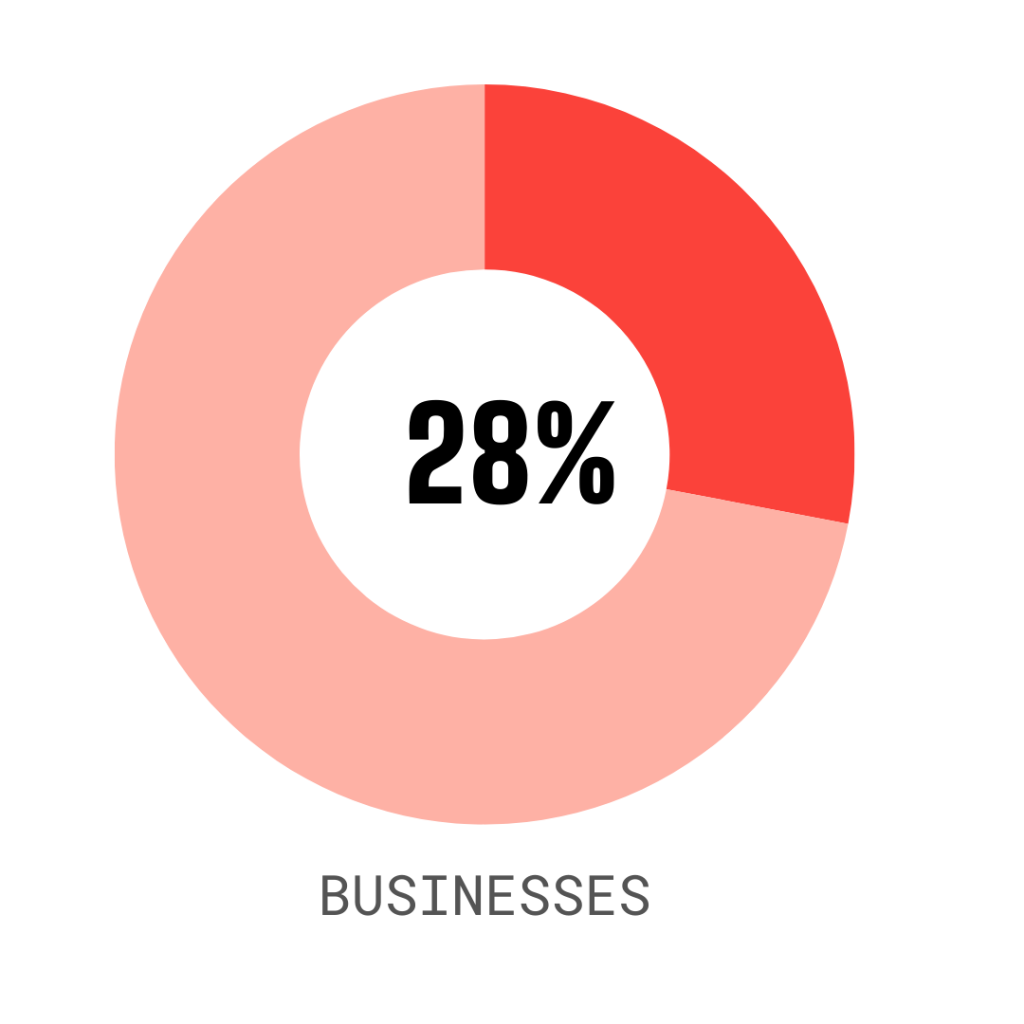
Hate acts most commonly occur in public spaces (51%) — including sidewalks, parks, or transit — and
businesses (28%) — including restaurants, supermarkets, or gas stations.
“I was working at an Asian grocery store part time. Our store got a phone call from a stranger. … [T]hat stranger threatened us to rob our store. That man said that Asians steal jobs and send all U.S. dollar back to China, so it is time to f–k our store up.”
– Woman, Midwest
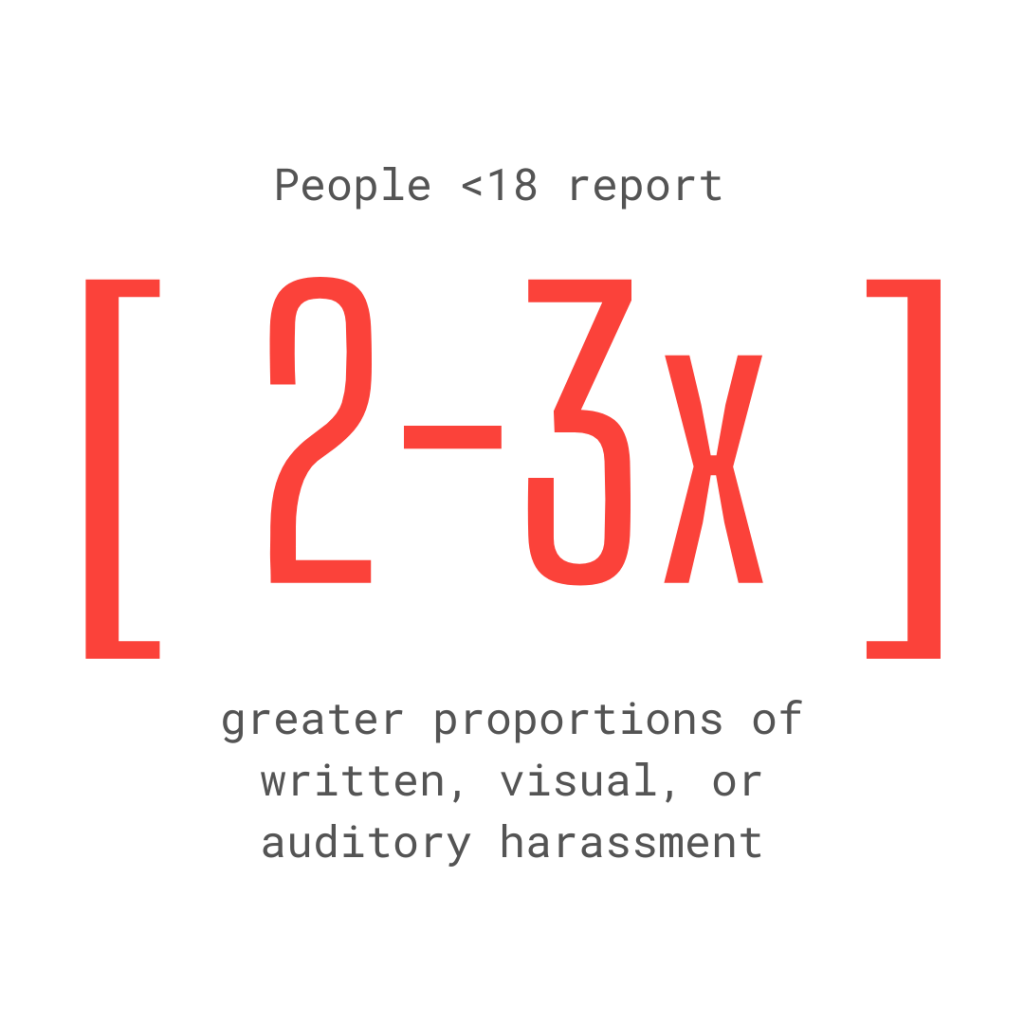
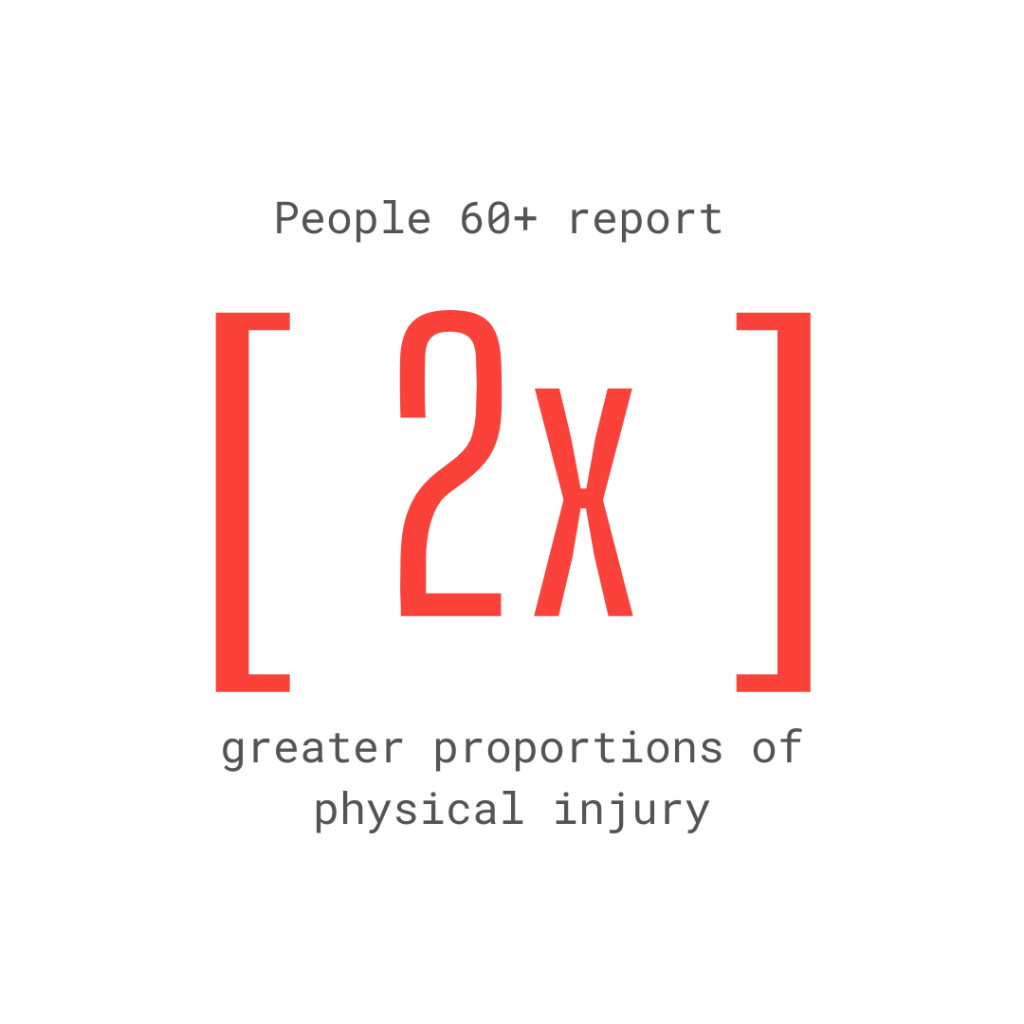
People under the age of 18 report a higher percentage of hate acts involving written, visual, or auditory harassment — most of which take place online and on social media. On the other hand, people ages 60 and over report a higher percentage of physical injury.
“[A] male came up to 78-year-old grandmother, who was jogging, unprovoked, struck her in the face, knocking her down, and running away. Causing nose bleed, cut lip, bruised thigh and hip, sore shoulder, and bloody elbow.”
– Woman, New York
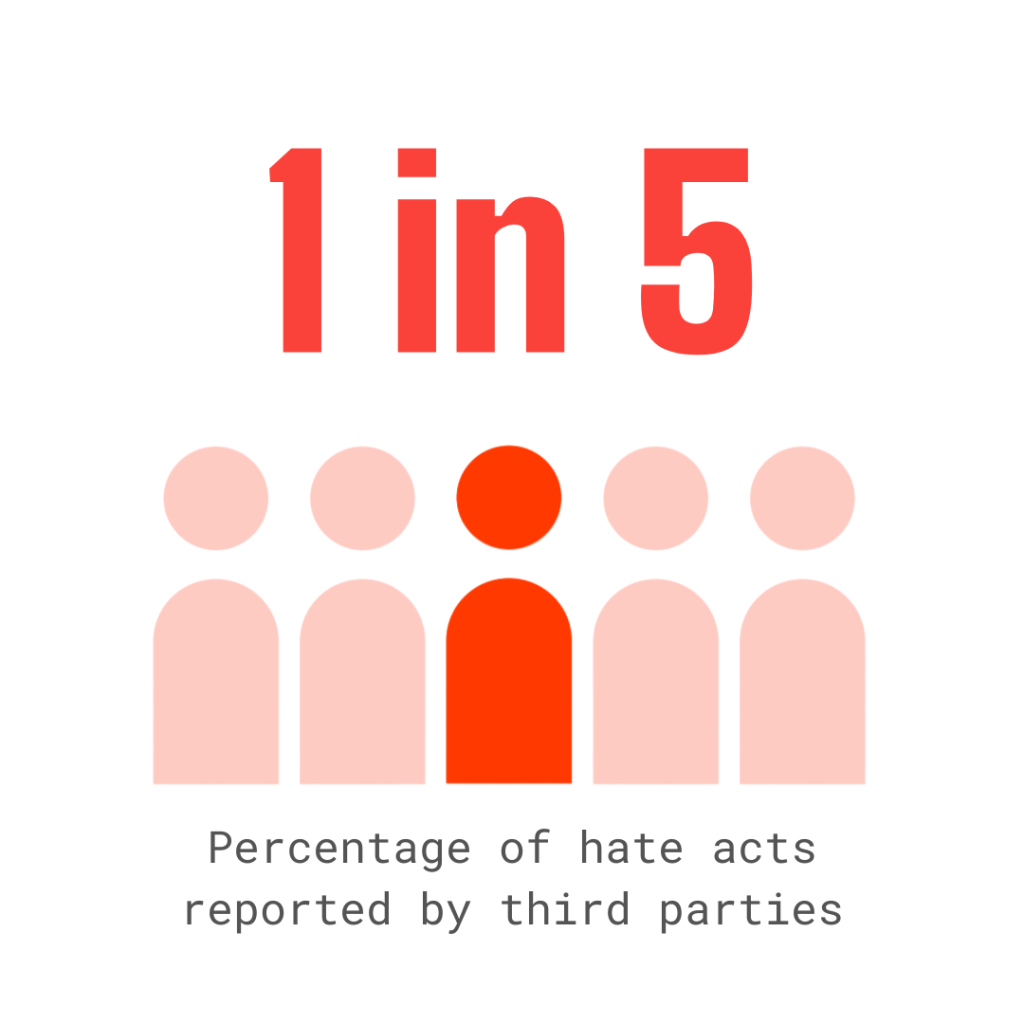
The support of third parties is critical in documenting acts of hate, with 1 in 5 people reporting on behalf of someone else, including friends, relatives, and even strangers.
“I’m reporting on behalf of my friend … He was at [a clothing store]. He went through racks and picked about 10 items. He went to a register to check out. An employee made a phone call, and an owner showed up in 10 minutes. The owner looked at items that my friend picked and she refused to sell anything to him. She is not willing to sell to Japanese dealers.”
– Man, South
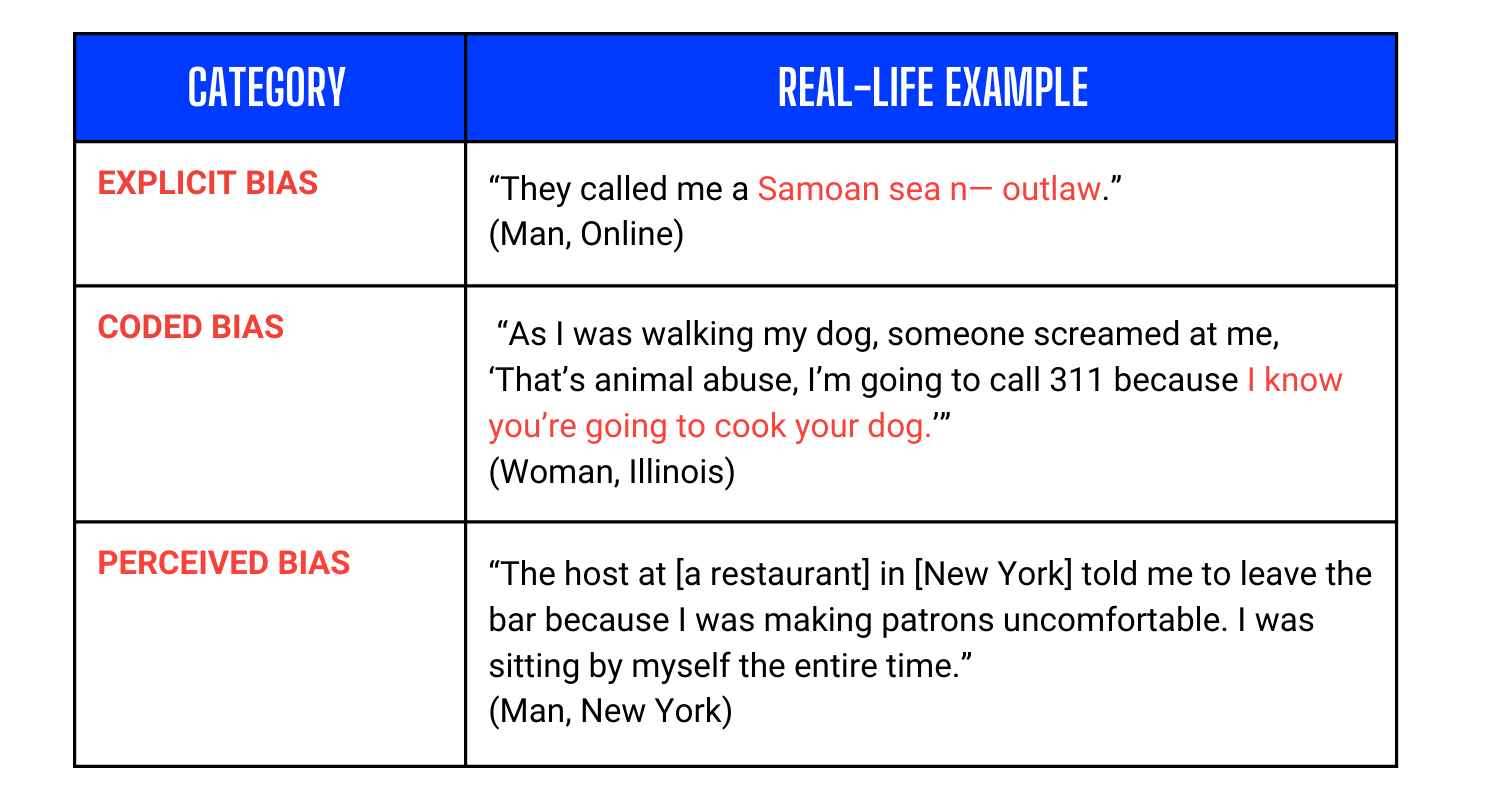
Over half (51%) of reported hate acts include explicit racial bias. 20% involve coded bias while 29% involve perceived bias.
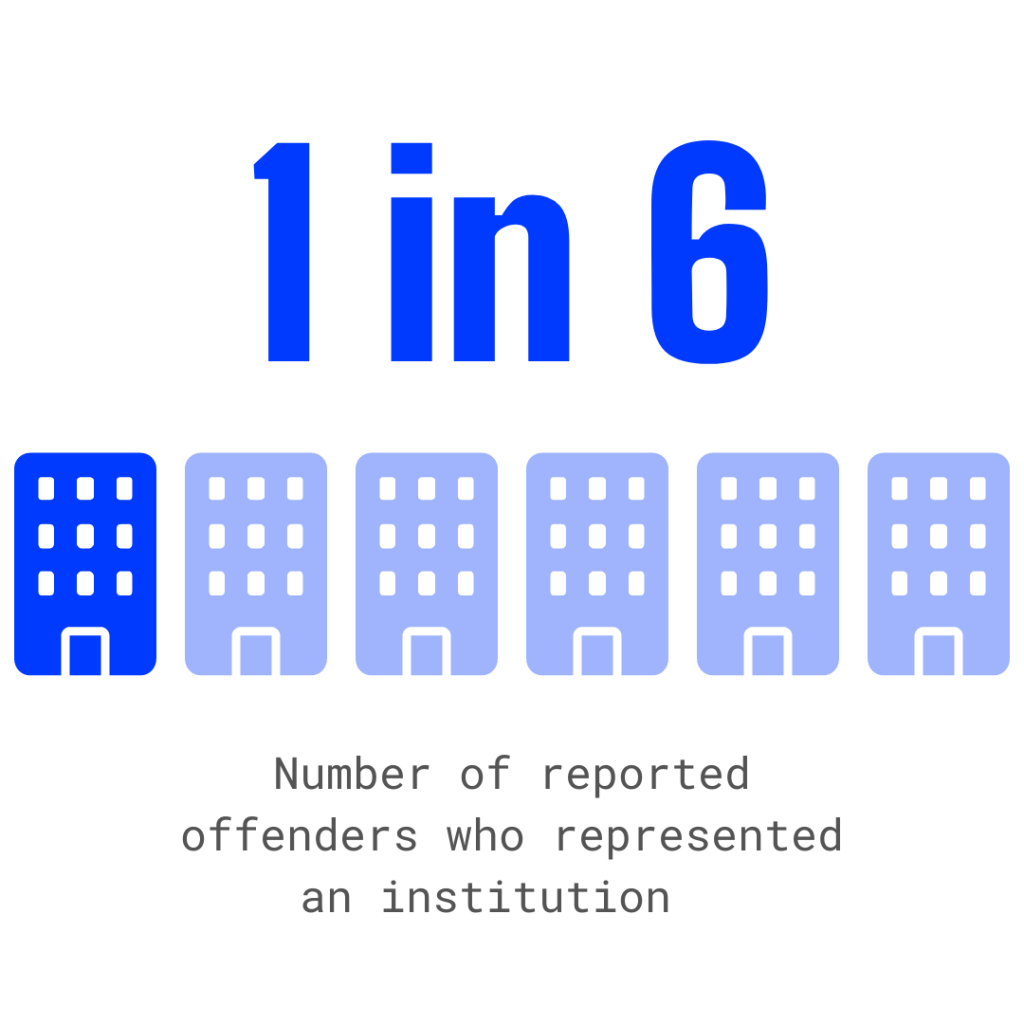
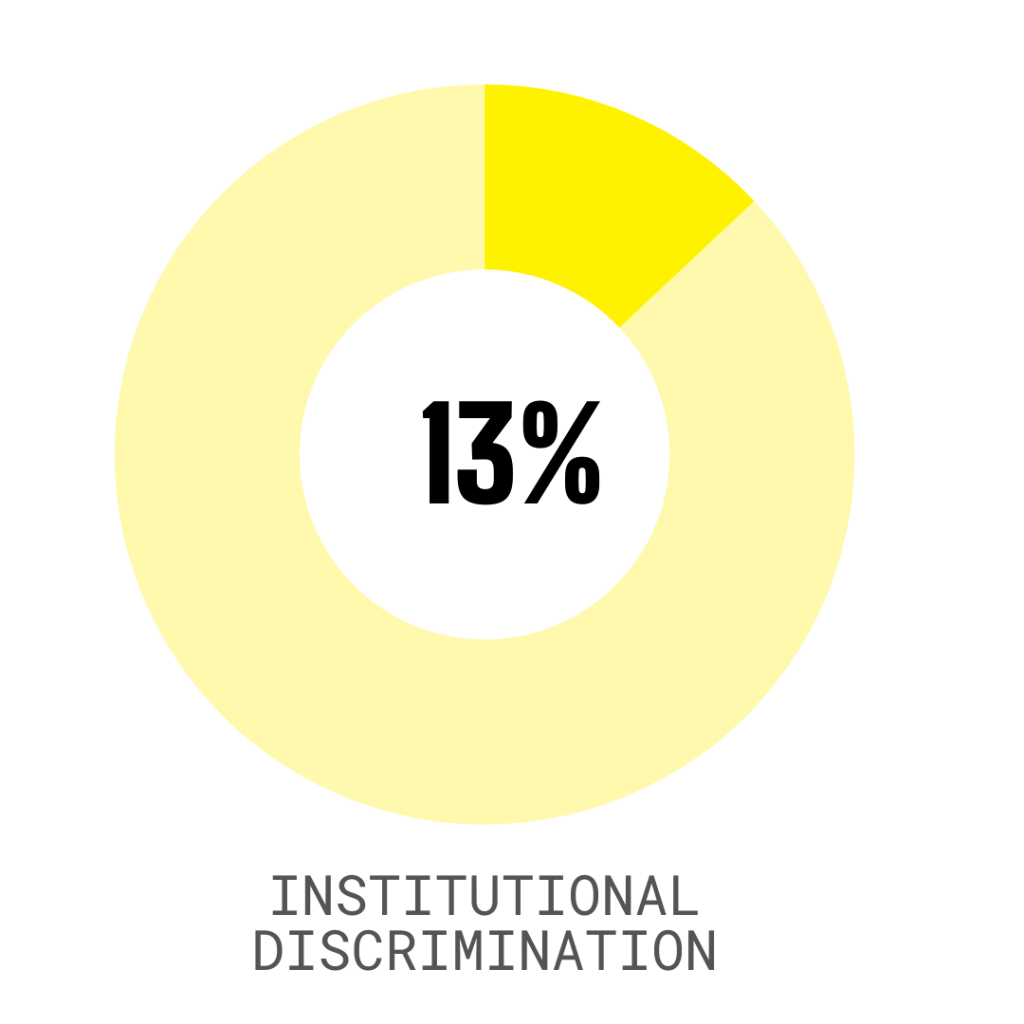
Hate is institutional as well as interpersonal. About 1 in 6 offenders worked for or represented an institution — offering insight into how racial bias manifests in institutions like schools or businesses.
“I was waiting for a bus at a bus stop, and a bus stopped in front of me briefly. The bus driver opened the door and yelled at me, ‘Nobody likes you.’”
– Woman, Washington
Learn More

Data Visualization
Use interactive dashboards and other dynamic features to learn more about our data set and what it tells us about anti-Asian and anti-Pacific Islander hate.
Research and Reports
Read our latest research and reports to learn more about AAPI communities’ experiences with racism and discrimination.